
Participants are back from holidays; we take stock of the paper market, how sentiment has changed and the dominant factors driving oil prices. CTAs and momentum funds are currently taking a back seat to fundamentals, which are back in focus. Sentiment has bottomed and a new narrative is building in the trading community psyche.
For (commercial) producers, there are important implications as targeted hedging levels should be modified and option structures carefully chosen due to value dislocations and cost differentials.
CTC TRADING VIEW: Market sentiment has bottomed out and a new narrative in the oil market is building with a focus on fundamentals.
The market is repricing, which we noted for several weeks, the lows of June driven by an extreme pendulum swing in sentiment – SEE CHART 2 – The oil market is tightening, global oil + products stocks are drawing, extrapolation of a beat for non-OPEC production growth is being corrected lower and demand for refined products is nothing short of phenomenal. These factors are combined with an OPEC/NOPEC which is fully committed to achieving a more balanced oil market.
Market bears have been proved wrong on a number of bearish data points, especially with regards to US production growth. Concerns remain for 2018, but this should dissipate as fundamentals tighten into Q4.
There is some $30 -$50 bil of capital on the side-lines that could re-enter short-term, liquid instruments in a narrow window. We know first-hand of the importance of large index flows and the way it can exacerbate and pressure term structure (i.e. timespreads).
Near term, the Brent curve has flipped into backwardation. A structural shift would have important implications for producer hedging – SEE CHART 1 – Price pullbacks should be shallower than year-to-date corrections and should be used as an opportunity to restructure.
Currently, there are “derivative dislocations” in the paper market and producers must be attentive to instruments and strikes as value varies greatly. We are also seeing a large discrepancy in execution price amongst banking names. Counterparty execution risk can currently lead to overall pricing shifting higher – CONTACT THE DESK FOR MORE ON THIS –
PRICE ACTION & POSITIONING: Participants need to be patient as market consensus is less skewed and trading conditions are volatile. Very short-term there is a momentum dislocation with crude oil outperforming refined products (i.e. not all technical signals are aligned).
The biggest excitement is in WTI where the 80k lots of fresh shorts on “Hurricane Harvey trade” are now clearly caught offsides and covering, providing a convenient offset for the post Labour Day increase in US producer hedging (who are selling against shorts buying back).
Contrary to early summer, paper positioning is a non-event with the overall analysis pointing towards a balanced picture.
This may change rapidly as our short, medium and long-term trading signals, replicating CTA/trend following fund models, point to a shift from “sell” to “buy” signals (in crude). This could ultimately prove to be the most important variable to watch, but the market is not yet there. We will alert our clients should this algo/CTA fund momentum be “ignited”.
In terms of specific levels, Brent’s first target is the May highs of $54 – $55, then the $56.65 April highs have to be “taken out”. Resistance to a price move lower is clear with the market trading above all short and longer-term moving averages – SEE CHART 1 –
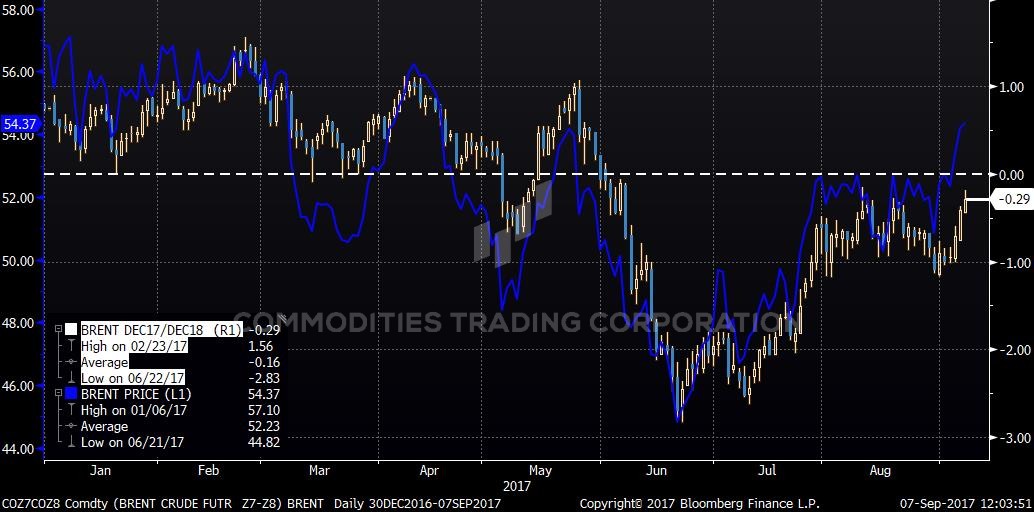
Chart 1 | ICE BRENT PRICE & DEC17/DEC18 SPREAD| Daily since Jan17 | Source: ICE, Bloomberg & CTC
HEDGING FLOWS:
1. PRODUCERS: With WTI CAL18 swap above $50, hedging flows have accelerated. Our hedging flow analysis shows the focus is still on CAL18 but increasing to CAL19. Instruments used are swaps and 3-way collars.
From our conversations, we note that US producers hedged a significant percentage of their 2H17 forecast production and the hurricane impact suggests that some producers may be slightly over-hedged or uncomfortably close to it. We suspect that until this is fully resolved, it will affect some of the CAL18 hedge volumes. Hedging volume has capped upside price momentum moves but is being well absorbed by short covering from financial players and consumer hedging. To note, this is a major shift in recent months.
2. CONSUMERS: Very active, long-dated, volume buying across products; airlines, shipping companies and refiners have locked in forward prices and margins. Many, especially in the shipping community, are restructuring (or taking outright profits) of in-the-money hedges at current levels. Risk managers have become traders, a phenomenon we have seen too often.
Paper consumer flows are keeping prices elevated across the barrel, especially via time spreads and regional product spreads and cracks. If anyone questions the strength of demand, look no further than these reliable data points on consumer flow.
OIL SUPPLY: As we noted several times to our clients, the extrapolation of “beat” in supply growth expectations was outright wrong (also pushed by sell-side research). Libya’s spike to 1.01 mil bpd in July was halted in the order of 350k bpd by yet another “militia” disruption. There are reports that Sharara’s pipeline to the Zawiya refinery is now reopened. The takeaway is that Libyan barrels cannot be relied on (for now 1 mil bpd day is the best that can be expected). The situation is nowhere near to be resolved and further disruptions should be expected as it is not “oil business” as usual there.
In terms, of non-OPEC growth, the US is a prime example where perceptions and expectations are very high. We had few data points to substantiate our view at the time, which was that US production growth forecasts were too aggressive. However the variance between forecasts (based on “noisy” weekly data) and monthly production (back dated) has widened dramatically. US reported monthly production for May and June was over 200k bpd less than what was extrapolated from weekly EIA data.
This is very significant and risks remain that US production may not reach 9.75+ mil bpd by year-end and 2018 production forecasts may have to be revised lower. To make the point even clearer, Q2 official numbers were 9.13 mil bpd, latest June data was 9.1 mil bpd and the forecast for Q4 is 9.75 mil bpd. Given lower rig count, various infrastructure issues due to Hurricane Harvey (pipeline, storage terminals, railcars etc), the ramp up in production is unlikely to happen at WTI $50 and below. Simply, WTI will have to push convincingly north of $50 bbl or US production forecasts will be a big miss.

Chart 2 | Negative Oil Story Count (White) vs. Oil Price (Orange)| Daily since Jun 15 | Source: Bloomberg
SUMMARY VIEW: The “bull” confidence was battered in June/July, just when physical draws in visible stocks were on the cusp of kicking in. Stock draws are now happening and will intensify as we move into year-end. Big picture there are a multitude of factors aligned ahead:
(1) OPEC/NOPEC: The market is factoring in a base case of 3 months extension to the cuts. Our conversations and read is that there is a clear commitment (incl. Russia) from OPEC/NOPEC to work towards the 5yr average OECD oil stock target. We advise our clients not to doubt OPEC’s available tools. Further, there is no reason to doubt a controlled exit strategy (as opposed to a flood) which the market is still nervous about for 2018.
(2) Non-OPEC: High expectations for non-OPEC production (especially the US) has been factored in to the price. Nigeria and Libya production are at risk to disappoint. US growth is evidently impressive but will be significantly lower than perceptions (particularly at current prices).
(3) Demand: The fourth quarter represents the peak of global oil demand with the IEA is forecasting YoY growth of 1.9 mb/d. Macro indicators are healthy (see the strength in base metals and bulk prices). Unseasonably high refining margins suggest that refiners will most likely opt to defer maintenance. So much for the seasonal lull in crude oil demand.
(4) Floating storage (especially in Asia) should drawdown towards year-end: Global demand is not weakening.
(5) Strong potential tailwinds from the investor community: The total notional invested in oil is low and could quickly gush back into oil-linked financial instruments – CONTACT THE DESK FOR MORE ON THIS – The flattening of the Brent curve structure will attract pension portfolios rotating their allocations towards commodities (as backwardation means investors are paid to hold a long position).
Contact CTC to know about more about how we help with risk-management, hedging related services and trading views: contact@comtradingcorp.com.
Leave us a feedback
[contact-form-7 id=”3212″ title=”Feedback”]
Commodities Trading Corporation is a London-based private advisory company specialized in commodity risk-management and hedging. We service a growing need in the natural resources sector for unbiased and strong expertise and provide our services to an array of corporate clients and financial institutions. We are experts in derivatives and monetizing volatility and develop corporate strategies for hedging energy portfolios, using bespoke derivatives solutions for price risk mitigation.
For more information about what we do, how we can optimize your hedges and directly improve your bottom line, contact us at contact@comtradingcorp.com.
Authorised and Regulated by the Financial Conduct Authority (“FCA”).
CTC Marketing Commentary Disclaimer – This marketing communication has been prepared by CTC traders and sales personnel. The information contained within this marketing communication is general market commentary providing only the views an opinions of CTC traders and sales team. The views and opinions expressed herein may be changed at any time without notice. This material provides only a limited view of the market and does not constitute investment advice and or investment research. It has not been prepared with the legal requirements to promote the independence of investment research. It is also not subject to any prohibition on dealing ahead of the dissemination of any investment research. The information provided does not constitute an inducement, invitation or offer to engage in any investment activity. CTC neither makes nor gives any representation or warranty, express or implied as to the accuracy or completeness of the information and opinions contained and no responsibility or liability is accepted by CTC for the same and CTC shall not be liable for any direct, indirect or consequential loss or damage suffered or incurred by any person upon reliance of any statement or opinion or other such information. This communication is directed at CTC‘s professional customers and not intended for retail or private customers.