
Analysing hedging flows and chart technicals have provided key inflection points for oil prices. The picture, as it currently stands, suggests that oil prices are forming a floor on the back of past two week’s selloff.
Short-term prices continue to face downside risk, primarily driven by our read that US weekly inventory data could be negative. Still, the picture is significantly more constructive for oil and time spreads should outperform flat price as we get closer the $55 bbl level.
PRICE ACTION: As one of the greatest speculators once wrote in his trading memoir on markets “…it is designed to fool most of the people, most of the time…” and recent oil price volatility is a textbook case. Analysis of volume, price and pivot points suggests that the paper market has inflicted max pain, which put simply, is to inflict P/L loss to the maximum number of participants.
Now that max pain has been achieved, oil prices are reverting back towards its original trading range.
The psychological impact to market traders must not be underestimated at this point, as many have “thrown in the towel”. Bulls need to build much destroyed confidence and shorts, who are the less battered, are not ready to trade in size with the OPEC meeting ahead.
The volume weighted average price (VWAP) levels were indeed key pivot points to monitor for CTA/ trend following fund short covering.
Our analysis shows that there is still “money caught offsides” at current ~$52 bbl level in ICE Brent ($49 bbl in WTI).
A stable price floor is building, so long as the oil price closes above these key levels. The continuation of higher prices should increasingly force these short positions to unwind and provide an upside tailwind to price.
We pointed, in Brent, to the $51.65 bbl level (which represents the 200-day-moving-average and the 50% retracement from recent peak-to-through) as a key price level to monitor. As it stands, the market is “sitting” right above this important pivot level which, from a chart/momentum perspective, means that oil is reversing into a bullish pattern.
The momentum picture is turning quickly but note that our short to long-term trading signals, replicating CTA/trend following funds, still point to “Sell” signals – contact the desk for more on this –
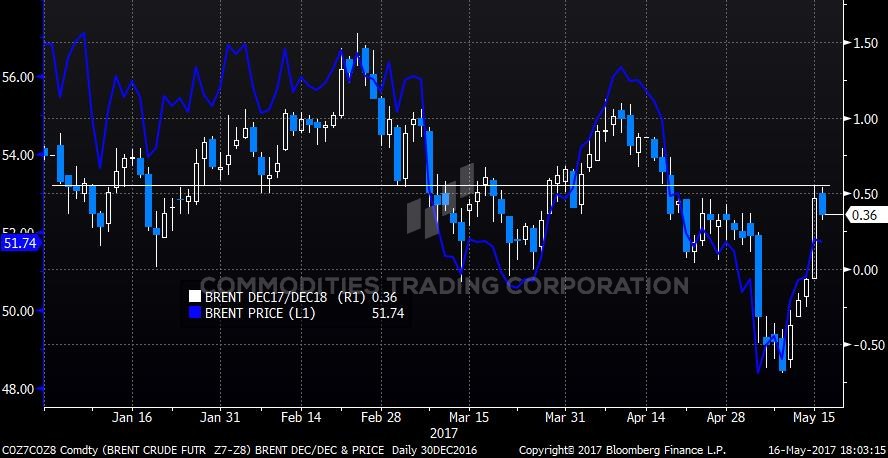
Chart 1 | Brent: Year-to-date DEC17/DEC18 Spreads & Price | Source: Bloomberg & CTC
TIME SPREADS: One of the main takeaways from past trading sessions is the outperformance of spreads versus flat price – SEE CHART 1 – Brent DEC17/DEC18 has moved from over $0.60 bbl contango to over $0.30 bbl backwardation.
This is precisely what OPEC wants: A backwardated curve where commercial producers are dis-incentivised to hedge and where producing OPEC countries sell at the highest point on the curve (i.e. spot) – SEE CHART 2.
The oil curve is flipping in OPEC’s favour, at least in this price rise from recent lows. It intuitively makes sense given there is probably some pre-hedging in anticipation of a price rise back into the $55 bbl range where the return of producer hedging is expected in size. This hedging flow is constructive for time spreads and for the curve to flatten.
We should reiterate that, historically, a move to backwardation throughout the curve means it tends to stay this way for a long time.
In terms of forward levels which are expected to trigger US producers hedging – SEE CHART 3 – which is one of the most concise charts indicative of price and hedge programs.
HEDGING FLOWS & POSITIONING: Volumes have significantly dried up in past days. Recent producer restructuring is now less attractive at current oil prices but levels are still unattractive for layering hedges (i.e. selling forward).
Consumers were very active forward buyers in the dip (in volume, across products and in long maturities) but this flow has now receded and they are not chasing prices higher.
The analysis of CTA/momentum fund flow is interesting. It points to reduced net long exposure across the energy complex, not reduced by long liquidation, but almost entirely (90%) reduced by fresh short positions.
The fact that open interest increased as CTAs sold, but also increased as price recovered clearly points to further short covering if oil prices continue to recover. In other words, a lot of shorts are “caught offsides” at current levels.
Net notional long in both WTI and Brent is now at $20 bil – it was over $60 bil back in Feb and well below the $50 bil 5-year average. This clearly points, that under the right conditions, there is significant amount of bullish money on the side-lines which could enter the sector.

Chart 2 | Brent Forward Curve: Last, 1 week ago & 1 mth ago | Source: Bloomberg & CTC
FUNDAMENTALS: The two most important players came to the oil price rescue this week as Saudi and Russian energy ministers appeared in Beijing at a joint conference and confirmed they agree to extend output cuts through the end of 1Q 2018.
This is important as it destroys recent market fears that Saudi Arabia’s loss of market share could jeopardise the production deal. Using Mario Draghi’s “…whatever it takes” as a central, means that they are fully committed with the 5-year average OECD stocks target, as the “forward guidance”.
The Pavlovian conditioning for the trader is powerful; you do not want to fight the Fed, in this case, Saudi Arabia and Russia’s oil authority.
“Beneath the surface”, there are bright spots: time spreads are outperforming flat price, physical crude differentials and non-exchange traded products are trading relatively firm.
A significant part of floating storage, especially in Asia, is already accounted for in stocks and some stocked in ships, assigned for mainland China or will show up in tanks.
Despite the improving Supply/Demand outlook, US oil statistics could disappoint this week as certain tanker tracking sources point to increase US imports combined with higher Strategic Petroleum Reserve (SPR) releases.
If the data does indeed come in negative, the dips should be bought, producers should use it for any missed restructuring opportunity.
As we look to factors ahead, it looks increasingly positive to us:
(1) OPEC: There is now clear and strong commitment, a record high compliance rate and now an extension of cuts at least until 1Q18. All doubts and recent market fears are put to rest on that angle,
(2) Higher US/ Non-OPEC production is now factored in. The surprise return of Nigeria’s Forcados (250 k bpd) and Libya’s production above 800k bpd is now factored in and on balance has more a risk to disappoint than increase significantly from these levels,
(3) The bulk of refinery maintenance will be behind by end of May and crude throughput will increase,
(4) OPEC domestic destocking has been so high that we can safely assume it is/ or close to being behind us. In 2H17, we can expect OPEC’s exports to be much more aligned with production, which will quickly impact visible stocks,
(5) Floating storage (especially in Asia) is expected to drawdown in 2H17 as independent “teapot” refiners get their new quotas allocated combined with storage moving into mainland China,
(6) strong tailwind from derivative positioning in the form of short covering and significant money on the side-lines to enter combined with supportive technicals,
As mentioned last week, oil producers should stay on hold for more attractive levels ahead. We continue to see placing Cal18 3-way hedges with strikes 40/55/65 in Brent and 40/53/60 in WTI as the target to reach at attractive premiums.
The median analyst estimate puts Dated Brent at $61.50-$62.00 bbl for Cal18 and $60 bbl for WTI.
In a reflection of high options volatility recently, the derivatives market (straddle) prices Dec18 Brent in a wide $42-$62 bbl range and WTI at $42-$56 bbl.
Contact the desk to discuss risk-management and hedging related services contact@comtradingcorp.com.

Chart 3 | Producer Hedging Activity Versus Calendar Strip Prices | Source: SDR, MS Commodities
Leave us a feedback
[contact-form-7 id=”3212″ title=”Feedback”]
Commodities Trading Corporation is a private advisory company specialized in commodity risk-management and hedging. We service a growing need in the natural resources sector for unbiased and strong expertise and provide our services to an array of corporate clients and financial institutions. We are experts in derivatives and monetizing volatility and develop corporate strategies for hedging energy portfolios, using bespoke derivatives solutions for price risk mitigation.
For more information about what we do, how we can optimize your hedges and directly improve your bottom line, contact us at contact@comtradingcorp.com.
Authorised and Regulated by the Financial Conduct Authority (“FCA”).
CTC Marketing Commentary Disclaimer – This marketing communication has been prepared by CTC traders and sales personnel. The information contained within this marketing communication is general market commentary providing only the views an opinions of CTC traders and sales team. The views and opinions expressed herein may be changed at any time without notice. This material provides only a limited view of the market and does not constitute investment advice and or investment research. It has not been prepared with the legal requirements to promote the independence of investment research. It is also not subject to any prohibition on dealing ahead of the dissemination of any investment research. The information provided does not constitute an inducement, invitation or offer to engage in any investment activity. CTC neither makes nor gives any representation or warranty, express or implied as to the accuracy or completeness of the information and opinions contained and no responsibility or liability is accepted by CTC for the same and CTC shall not be liable for any direct, indirect or consequential loss or damage suffered or incurred by any person upon reliance of any statement or opinion or other such information. This communication is directed at CTC‘s professional customers and not intended for retail or private customers.