
Last week’s selloff to last Friday’s low of $46.65 bbl in Brent caused a lot of psychological damage in the market.
As it stands today, investor positioning has “cleaned up”, improved fundamentals in the form of stock draws are imminent and the OPEC meeting is only two weeks away.
Funds and weak technicals triggered the selloff, not a sudden change in fundamentals. Hedging flows, provide interesting clues as to current positioning. Our read is that the market is at risk of a “slingshot effect” (with OPEC meeting ahead).
The market currently provides an opportunity for producers to restructure hedges and take advantage of current (and temporary probably) “derivative dislocations”.
PRICE ACTION: The selloff late last week was violent, especially the last $2.5 bbl triggered once the $50 bbl “line-in-the-sand” was broken.
The $50 bbl level, we had mentioned several times, created almost a binary effect, with the break causing an avalanche of selling.
As expected, extreme managed money length that had been present since the announcement of the OPEC/NOPEC deal was “all same way” and using the $50 bbl technical level as a portfolio stop.
The data clearly shows that CTAs/momentum type funds were the aggressive sellers causing acceleration in price moves lower, on increasing volume combined with open interest. The selling ranks in the top 5 sessions in recent history measured by its speed, volume and rapid change in open interest.
The price recovery is interesting, as the read of CTA flows permits opportunities for our clients as well as investors.
Indeed, the key “pivot points” were the volume weighted average price (VWAP) levels (WTI = $46.25 -$46.50 and Brent = $49.30 – $49.60). Once the selling momentum faded, the recovery in prices stalled at the VWAP .
A move above caused short covering by CTAs as they were at that point “caught offsides”. There was a last, unsuccessful attempt to “push prices” lower on the exchange close yesterday.
The market close above $50 changed the negative technical picture, and explains the rally to ~$51 bbl in Brent currently. Yesterday was the largest up day for oil since the OPEC/NOPEC announcement in 4Q16.
These are the key chart technicals and “pivot points” for Brent:
(1) On the downside, the $50 bbl level remains key,
(2) On the upside, resistance is at $51.65 bbl. This level is the 100-day-moving-average as well as the 50% retracement from recent peak-to-through. A convincing close above $51.65 bbl raises the potential for a move back into the $55 bbl range. A move through $58.37 bbl, recent high post OPEC/NOPEC deal, opens up the possibility of a move higher to $60 – $62.50 bbl.
HEDGING FLOWS: Analysing recent hedging flows provides interesting information of the oil market’s current positioning (and the way it could react to new information).
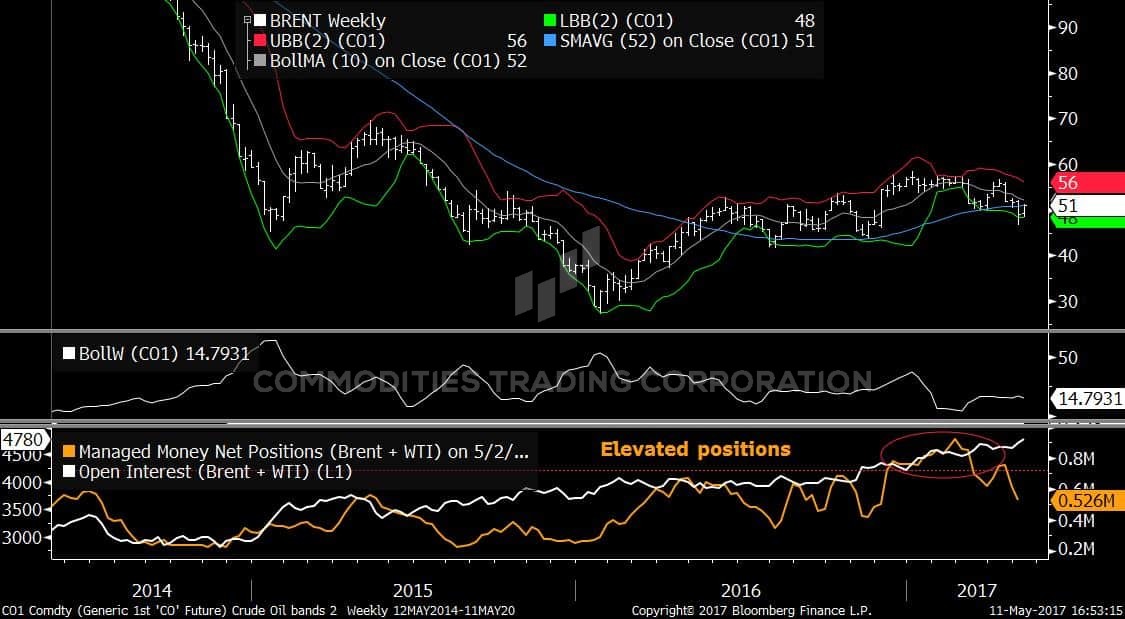
Chart 1 – Brent– Weekly 3years – Source: Bloomberg & CTC
In the hedge fund world, while there have been liquidations from commodity specific funds, macro type hedge funds have placed large positional bets via long calls and call spreads with expiry post OPEC meeting.
Traditional producer selling activity has been practically non-existent, but it is important to note that there has been significant volumes of producer type, hedge restructuring.
The restructuring trades have permitted the monetising of the in-the-money hedge and restructure into option structures, which do not cap upside if oil prices rise. We believe the market remains attractive for producers to restructure their hedge portfolio.
CTA/momentum fund selling was absorbed, in large part, by strong consumer buying activity. The exchange data and our conversations with market participants and our clients point to large and long dated buying (ex: gasoil into Cal20).
The fact that consumers across the barrel (jet kero, fuel oil, gasoil) were buying aggressively suggests: (1) an oil price floor, and (2) there is strong demand, with dips seen as an opportunity to layer in consumer hedges.
FUNDAMENTALS: US oil data this week was supportive and a timely relief for the market.
US oil stocks fell for the first time in three weeks, in combination with a drop-in product stocks (especially important was gasoline) lower crude imports, as tanker tracking data suggested (referred to here last week).
Visible draws in US oil statistics will continue to have a positive impact on time spreads. Brent time spreads have outperformed Brent flat price in the recent correction on news that Buzzard maintenance in July will cut normal production of 180k bpd by 30-40%.
Both prompt spreads and longer dated spreads such as Dec17/Dec18 have firmly recovered and point to higher oil prices ahead.
Note as well that the 200 DMA proved to be a critical support, that held, for Brent – SEE CHART 2
An expectation of backwardation is premature but certainly seeing a move back towards small positive territory for Dec17/Dec18 is in the cards.
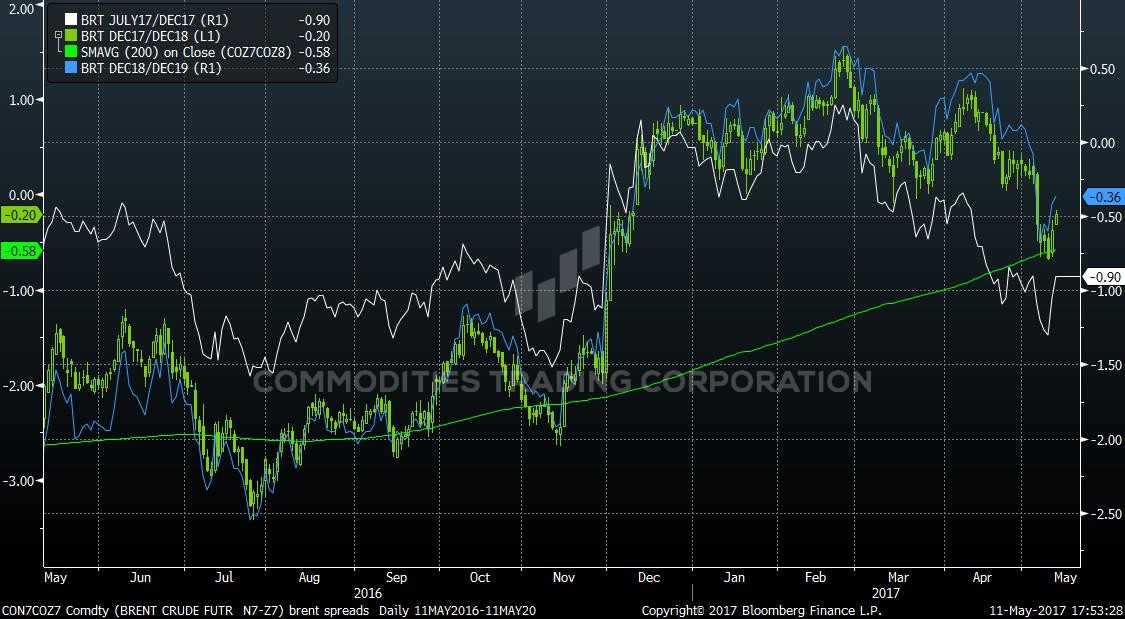
Chart 2 – Brent Spreads – Daily 6 month – Source: Bloomberg & CTC
The main issue here are that the barrels going to Asia are on hold as Chinese “teapots” still have not been allocated their new import quotas and demand will be moderate until these are back pulling barrels.
On the headline front, US stock draws was exactly what the market needed. The mention in the market for the first time of the extension of OPEC cuts into 2018 by Saudi’s oil minister Al-Falih was clearly supportive. Additionally, Saudi Aramco has cut June crude shipments to Asia by 7 mil bbl.
It is of note that the Saudis have remained engaged with the market for several months now and helps discredit the market fear that OPEC, and particularly Saudi Arabia, may be less committed because of market share loss.
Concerning the latest on OPEC – SEE CHART 3 & TABLE 5 BELOW.
The overall physical market, based on crude oil differentials and non-exchange traded products (ex. naphtha, fuel oil) is holding, not collapsing.
There is still oil to clear in the North Sea as seaborne light sweet will compete with added barrels from Nigeria with the announcement of Forcados stream (250 kbd) back in operation (it was down since early 2016) and a surprise rise in Libyan supply (above 800 kbd according to NOC), and the highest since Q3 14.
IN SUMMARY: We believe that the market is at an important juncture: The “spec” positioning is as “clean” as it has been in a while, which means that there is significant “dry power” for buying flows to enter oil markets.
Global refinery maintenance will soon be behind us as we move towards the summer (with the return of Chinese independent refineries buying as well).
The unwinding of 50+ mil bbls of “unreported stocks” (i.e. not reported in energy agencies’ balances) means that the market is too focused only on US stock levels (which will be the last to draw).
The picture therefore is more constructive than recent price action indicates. The market positioning setup means that if OPEC was to announce, longer and deeper cuts, the market would see an explosive move higher. This may not be our “base case” but it is not an impossibility and important to be aware of how the market could react. We believe the direction is skewed towards the upside.
Oil producers should stay on hold for more attractive levels. Levels to target are in Cal18, 3-way hedges such as 40/55/65 in Brent and 40/53/60 in WTI where the level reached provides attractive premiums .
Contact the desk to discuss risk-management and hedging services – contact@comtradingcorp.com.
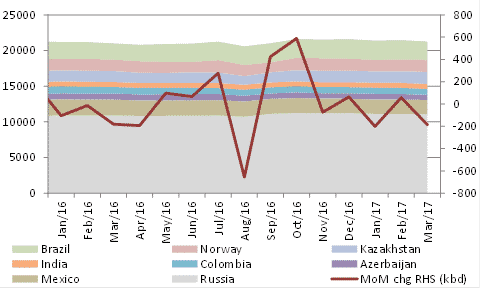
Chart 3 – NON_OPEC Production – mil bpd –Source: Goldman Sachs
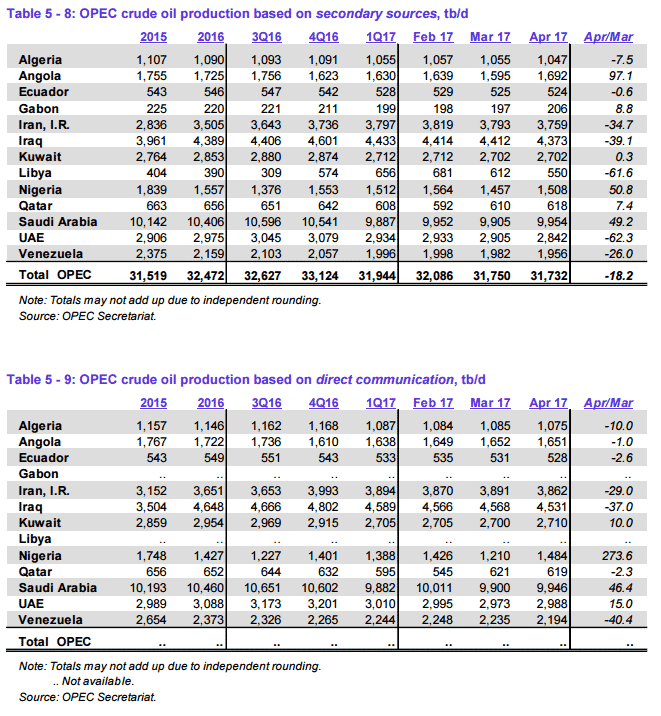
OPEC Production
Commodities Trading Corporation is a private advisory company specialized in commodity risk-management and hedging. We service a growing need in the natural resources sector for unbiased and strong expertise and provide our services to an array of corporate clients and financial institutions. We are experts in derivatives and monetizing volatility and develop corporate strategies for hedging energy portfolios, using bespoke derivatives solutions for price risk mitigation.
For more information about what we do, how we can optimize your hedges and directly improve your bottom line, contact us at contact@comtradingcorp.com.
CTC Marketing Commentary Disclaimer – This marketing communication has been prepared by CTC traders and sales personnel. The information contained within this marketing communication is general market commentary providing only the views an opinions of CTC traders and sales team. The views and opinions expressed herein may be changed at any time without notice. This material provides only a limited view of the market and does not constitute investment advice and or investment research. It has not been prepared with the legal requirements to promote the independence of investment research. It is also not subject to any prohibition on dealing ahead of the dissemination of any investment research. The information provided does not constitute an inducement, invitation or offer to engage in any investment activity. CTC neither makes nor gives any representation or warranty, express or implied as to the accuracy or completeness of the information and opinions contained and no responsibility or liability is accepted by CTC for the same and CTC shall not be liable for any direct, indirect or consequential loss or damage suffered or incurred by any person upon reliance of any statement or opinion or other such information. This communication is directed at CTC‘s professional customers and not intended for retail or private customers.