
The heavy selling and volatility Wednesday was driven by the front of the curve technical positioning. Gasoline again proved to be a good “leading indicator” for crude flat price direction, as we have pointed out previously. Implied volatility was higher as would be expected but the very front spreads kept firm.
Technicals: Rbob was the signal to watch again, as it gave an early warning. The crossover of the 10 day-moving-average (DMA) below the 100 DMA (followed by the 50 DMA) was the trigger for the break below the all-important post OPEC/NOPEC range.
Rbob is not breaking down below its support for now, nor does it seem that it will close above levels to clear the short-term bearish signals. For now, the overall short-term chart pattern remains bearish.
The catalyst for the selloff was a combination of factors: DOEs were in-line with APIs, and Crude inventory did come down but gasoline was up and US crude production is clearly rising (note that the selloff started ~1 hour after the data release). Headlines on deal extension were not supportive, as fully factored in the market by now and were no support.
We have been pointing out the 10 DMA and 100 DMA as CTA/momentum fund buy/sell signals and Wednesday proved to be an extreme case of this – SEE CHART 1 – it shows Wednesday’s WTI trading session with volume at time and volume at price. The crossover of the moving averages triggered the selling and support only came (as can be seen form the volume) at the $50.40 area (in WTI) which is the first main support at the 50% retracement of the price recovery since 22 March.
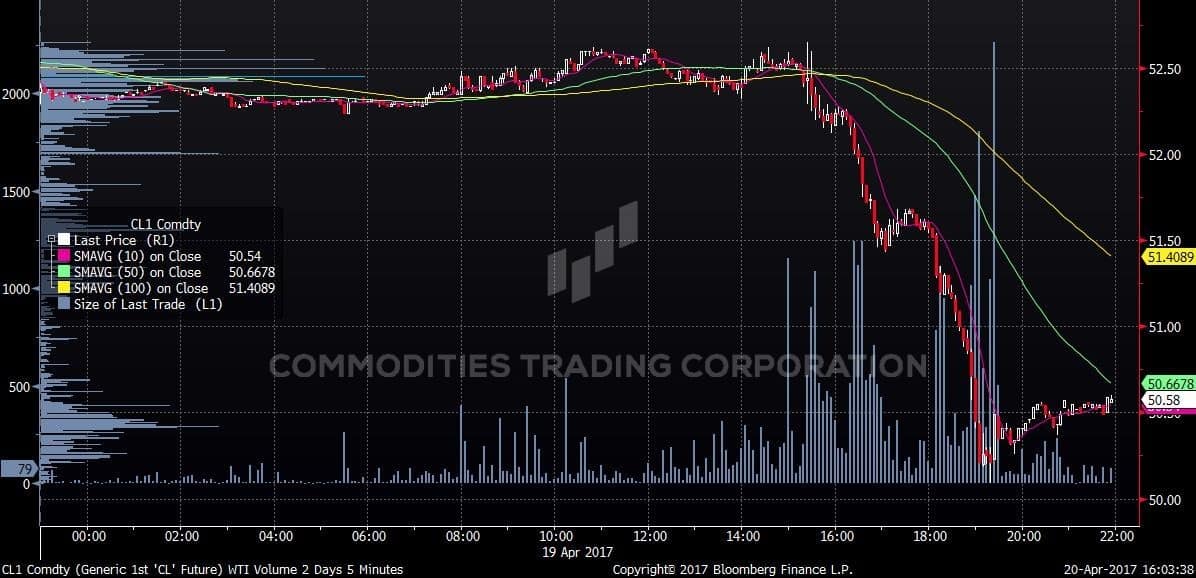
WTI – Volume At Time – 19APR Session – Source: Bloomberg & NYMEX
As far as we can see from the flow data and from our conversation in the market, we are not aware of any large producer type trade that would have been responsible for the selloff. The data shows a continuation of present but reduced producer hedging clips, mostly in WTI in 2H17 (including 40/51/60 3-ways). Prompt WTI spreads (and in Brent) held relatively firm given the magnitude of the selloff. Overall, US producers were apparently chasing the market lower this time (recent pattern was more “disciplined”) but the real selling came form hedge funds and CTAs.
The selling came in size from the front. Looking at the data, the options volume was huge especially in June contract (55 strike trade 30k lots). The volume was almost twice that of last year’s average. Options volatility was higher on the acceleration down and finished the day up over 2 vol points. In the high 20s volatility is not reflecting any heavy stress. If we look in terms of daily movement that flat price needs to fluctuate to justify these vols (below 90 cents in WTI), they are still comfortably below last year’s levels – SEE CHART 2.
A price close above the 100 DMA at $51.70 in WTI and $54.65 in Brent would negate the short-term bearish pattern. If that was the case, a price move back into the range would make push volatility lower. Contact the desk for further trading views and optimal hedging strategies.

WTI daily volatility breakeven – Source: Bloomberg, NYMEX & CTC models
Commodities Trading Corporation is a private advisory company specialized in commodity risk-management and hedging. We service a growing need in the natural resources sector for unbiased and strong expertise and provide our services to an array of corporate clients and financial institutions. We are experts in derivatives and monetizing volatility and develop corporate strategies for hedging energy portfolios, using bespoke derivatives solutions for price risk mitigation.
For more information about what we do, how we can optimize your hedges and directly improve your bottom line, contact us at contact@comtradingcorp.com.
CTC Marketing Commentary Disclaimer – This marketing communication has been prepared by CTC traders and sales personnel. The information contained within this marketing communication is general market commentary providing only the views an opinions of CTC traders and sales team. The views and opinions expressed herein may be changed at any time without notice. This material provides only a limited view of the market and does not constitute investment advice and or investment research. It has not been prepared with the legal requirements to promote the independence of investment research. It is also not subject to any prohibition on dealing ahead of the dissemination of any investment research. The information provided does not constitute an inducement, invitation or offer to engage in any investment activity. CTC neither makes nor gives any representation or warranty, express or implied as to the accuracy or completeness of the information and opinions contained and no responsibility or liability is accepted by CTC for the same and CTC shall not be liable for any direct, indirect or consequential loss or damage suffered or incurred by any person upon reliance of any statement or opinion or other such information. This communication is directed at CTC‘s professional customers and not intended for retail or private customers.